THE EFFECTS OF ENVIRONMENT ON ARTIFICIAL REEFS IN SARASOTA BAY
By
CORAGGIO MAGLIO
A Thesis
Submitted to the Division of Biology
of New College,
in partial fulfillment of the requirements for the degree
of Bachelor of Arts
Under the sponsorship of Alfred Beulig, Ph.D.
Sarasota, Florida
May 2001
Acknowledgements
ii
I
would like to thank all the people who have helped me to acquire the data and
knowledge needed to complete this thesis. I would especially like to thank Todd
Barber of Reef Balls Development Corporation for his time, boat, pictures and
information. Thanks Michael Solum and Bob Fluke of Sarasota and Manatee
counties for your help, boat, time and knowledge. A special thanks to Michael Solumn for taking me out on my final collection
dive when I was under serious time constraints. I would also like to thank all
my dive buddies who helped me with data collection, Josh Gange, Steven Wheeler,
and Rocco Maglio. I would like to thank my mother, sister-in-law and Giev
Askari for proof reading my paper. Thank you Kate Parr for helping me with
proof-reading and formatting issues. I would also like to thank everyone who
offered their help. A special thanks to Evelyn Luna, my girlfriend, who has
been understanding and supportive of me completing this research study even
though I had to alter plans we had made several times. I would also like to
thank Dr. Alfred Beulig for his help and research ideas and the rest of the New
College faculty and staff who have helped me over the last three years.
Table of Contents
iii
Acknowledgements ii
Table of Contents iii
Tables iv
Figures v
Abstract vi
Introduction 1
Review of literature
Natural Reefs 1
Trophic Dynamics 5
Significance of Coral Reefs 7
Threats to Coral Reefs: An endangered ecosystem 8
Artificial Reefs 10
Artificial vs. Natural Reefs 17
Materials and Methods 20
Project Location 20
Materials 26
Field Methods 26
Laboratory Methods 28
Results 30
Discussion 39
Problems encountered 39
iv
Design
Concerns 40
Implications of the Findings 41
Summary and Conclusions 45
Appendix A 46
Appendix B 48
References 49
Tables
v
Table 1: Date, Size, Depth, and Fishing Pressure of
Reef Sites 24
Table 2: Fouling Coverage at the Jantzen Reef in Percent 30
Table 3: Fouling Coverage at the Walker Reef in Percent 30
Table 4: Fouling Coverage at the Saprito Reef in Percent 31
Table 5: Fouling Coverage at the Hart Reef in Percent 31
Table 6: Fouling Coverage at the Gerkin Reef in Percent 31
Table 7: Current (m/min) and Averages at each Site 32
Table 8: Temperature (°F) and Average at each Site 33
Table 9: Visibility (m) and their Averages at the Reef Sites 34
Table 10: Incomplete Data Collected on Sedimentation 35
Table 11: Averages of Bottom Sediment Types and their % at the Reef Sites 36
Table 12: Averages of the Factors at the five Study Sites 36
Table 13: Values Entered into Multiple Regression Test 37
Table 14: Correlation Matrix for
the Multiple Regression Test 38
Table 15: Coverage of each of the
Bay Balls in Quadrants at 7-mile South Reef 47
Figures
vi
Figure 1 & 2: Artificial vs. natural reefs. 17
Figure 3: A ball covered with growth in Sarasota Bay. 20
Figure 4: Passes on the West Coast of Florida and study area. 21
Figure 5: Location of artificial reefs in Sarasota Bay. 22
Figure 6: Bay balls in Sarasota Bay. 24
Figure 7: Design plan of Hart, Jantzen, Saprito, and Walker reefs. 25
Figure 8: Wentworth classification system. 28
Figure 9: Dependency between the study variables. 29
Figure 10: Fouling coverage (ordinal) vs. visibility (m). 37
Figure 11: Fouling Growth on a Bay BallÔ in Sarasota Bay. 44
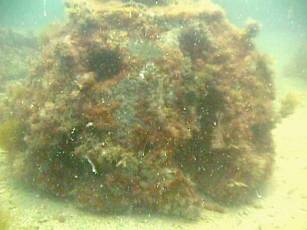
Figure 12: A picture of a Bay Ball in Sarasota Bay after less then a year underwater 47
The Effects of Environment
on Artificial Reefs in Sarasota Bay
vii
Coraggio
Maglio
New College of the University of South Florida, 2001
Abstract
The purpose of this study was to determine which of these factors: current, depth, sedimentation, temperature, or visibility influence fouling coverage the most. Data was collected on each of these components over a period of four months. Averages of each of the factors were computed and compared to an ordinal measurement of fouling coverage. Bottom sediments around each reef were collected and compared to what it is believed they should have been due to their environmental conditions.
These measurements were taken at five different reef sites in Sarasota Bay near New Pass. Some of these sites were well known to local boaters while others were completely unknown and unmarked. Factors such as this were also taken into account.
The hypothesis was that there is a relationship between one of the environmental factors and fouling coverage. It was not supported by statistical tests run on the environmental factors and fouling coverage.
______________________
Thesis Sponser
______________________
Academic Division
The Effects of Environment
on Artificial Reefs
Natural Reefs
What is a reef? It depends on who you ask, sailors use it to refer to a mass of fish or any navigational hazard that can damage their net. A scientist will tell you it is any hard structure made up of living or dead organisms. Three-dimensional calcium carbonate reefs have existed on the sea floor for less then 500 million years. These can be made of corals, red and green algae, cyanobacteria, worms and even oysters (Garrison 1998). There are two types of corals, reef building and non-reef building.
Non-reef building (ahermatypic) corals are normally found in cold water with low light levels. These corals are distributed throughout the world in much colder water temperatures and at greater depths than reef building corals (hermatypic) (Nybakken 1982). Since ahermatypic corals do not have a symbiotic relationship with dinoflagellates (microscopic single-celled organisms with flagellum), they are not dependent on light for photosynthesis therefore, they can live in cold, dark water. Since they do not have extra energy from symbiotic dinoflagellates, they do not waste energy secreting a rigid calcareous skeleton. Ahermatypic corals feed exclusively on passing plankton. There are two types of ahermatypic corals found on many tropical reefs sea fans and soft corals. Both grow at right angles to the prevailing current, thereby maximizing the amount of catchable plankton (Deitsch 1991).
References to coral reefs usually imply hermatypic reefs located in the tropics. These reefs are made up of compacted and cemented assemblages of skeletons and skeletal sediment of sedentary organisms living in brightly illuminated warm marine waters. The marine organisms that create reef structures leave behind complex frameworks of interlocked and encrusting skeletons of hermatypic coral and crustose coralline algae (Levinton 1982). Hermatypic corals all have zooxanthellae-endosymbiotic algae that benefit the host.
Coral reefs are colonies of cnidarians that build reefs by secreting hard skeletons of aragonite (a fibrous, crystalline form of calcium carbonate). These colonies are made up of individual organisms known as polyps, which feed on plankton that become entrapped by their tentacle’s stinging cells and are then carried to the central gastric cavity. They can also feed by absorbing dissolved organic matter through their body walls. Tropical coral polyps feed at night to avoid direct sunlight and predators.
Reef building corals also have a symbiotic relationship with tiny dinoflagellates called zooxanthellae. “These single-celled, plantlike organisms facilitate the rapid biochemical deposition of calcium carbonate into the coral skeleton. Coral’s success in the nutrient-poor water of the tropics depends upon their intimate biological partnership with zooxanthellae” (Garrison 1998). The zooxanthellae are spread out near the surface of the coral polyps to receive maximum sunlight for carrying on the processes of photosynthesis. They absorb metabolized by- products, providing photosynthetic resources that may be transferred to the host, and in exchange grow and divide within the protection of their host. They also provide the corals with oxygen, nutrients and the pH necessary for the deposition of calcium carbonate. In return the corals provide the zooxanthellae with a safe environment, carbon dioxide, and nutrients. The corals also occasionally digest some of the dinoflagellates for their own needs (Garrison 1998). This symbiotic relationship is very efficient in that it occurs with a minimal loss of nutrients. This is why there are flourishing ecosystems of coral communities in an apparent ecological desert.
Coral reefs are very sensitive indicators of water quality, i.e. light penetration (turbidity and sedimentation) and salinity. Since hermatypic coral growth is closely tied to their symbiotic relationship with zooxanthellae they therefore are also closely tied to bright sunlight. In deeper water, corals receive less sunlight penetration and thus grow more slowly. Also as depth increases the diversity of hermatypic corals decreases. Light penetration is similarly decreased by turbidity, a measure of the amount of suspended particles in the water. The sedimentation of these particles increases the amount of stress on coral by causing them to constantly produce mucus to remove these deposits. Too much sedimentation can lead to burial, scouring and ultimately death of a coral. Hermatypic corals also seem to require open-ocean salinity. Fully developed reefs normally do not occur near estuary areas because freshwater can be lethal. Exposure to this freshwater will cause coral to undergo osmotic shock. Rainwater, floating on the surface of more-dense seawater could be harmful to corals. For this reason reefs grow to meet the low water line. Runoff of rainwater near rivers causes another problem by carrying large amounts of sediment into the marine environment (Levinton 1982).
One of the more important environmental factors that influence the growth and distribution patterns of hermatypic corals is temperature. Almost all hermatypic corals are found within the 21°C (70°F) isotherm. This is essentially between 25° latitude north and south. Water temperatures below 18°C appear to be lethal for the zooxanthellae of these corals.
Three different types of commonly known reefs are atolls, fringing and barrier reefs (Darwin 1962). Fringing reefs form first around volcanoes, which are areas where molten lava flows to the surface creating new topography. This occurs near plate boundaries, areas of heightened tectonic activity, or over hot spots. As the plate carries the volcano away it cools and sinks due to its weight. The added weight of coral formation accelerates sinking. As the island sinks this fringing reef will gradually grow vertically, keeping up with the rate of sinking. As it sinks it forms a barrier with an intervening lagoon. Further sinking occurs and the island completely disappears beneath the sea’s surface creating an atoll, the final stage of this process. A continental barrier reef may form on an outer shelf that is shallow enough to allow hermatypic corals to grow. Barrier reefs are so called because they are large offshore reef complexes. Examples of this are the Great Barrier and Belize reefs. These two reef systems are the two most extensive continental barrier reef systems in the world.
Naturally occurring coral reefs can be broken down into many different zones. These include the reef slope, reef flat, and lagoon. The reef slope is the outer most part of a reef that rises from the sea floor to the surf zone, the area of breaking waves. The reef flat covers the area of wave action to where the lagoon begins. Within each of these zones there are further subdivisions. In the reef slope there is the fore reef (buttress zone) where the spur and groove (deep surge channels) topography is found along with the deepest and semi-flat symbiotic coral zone. The reef flat is divided into the reef crest, where the majority of wave breaking occurs, and the back reef, the shallowest portion of the reef system. The protected area behind the reef is where the lagoon forms. Depending on the openness of the lagoon to the sea there will be different types of structures formed such as sand sheets, shallow or patch reefs (Levinston 1982). This area gradually gets deeper and the currents slow down. Within each of these zones there are large estimate ranges of community productivity. The fore reef and reef crest both have an estimated productivity between 2.0-7.0g/m2day, the back reef productivity is within (2.6-40.0), and the lagoon (0.9-12.9). The back reef can have very high productivity due to its photosynthetic capacity (shallowness). The ranges vary because every reef has its own group of factors influencing production. The fore reef, reef crest, and back reef all have similar biomass estimates, while the lagoon has only about half the biomass. This low biomass is a result of the lagoon having little substrate because it is primarily sandy bottomed as well as much of the plankton is filtered out before reaching the lagoon (Odum 1955). Biomass is transferred between each zone by breaking waves, which can pull off algae, secretions, herbivory, and carnivory. The dominant primary producers of the outer reef slope are symbiotic corals and corallines. The major autotrophs of the reef flat are turfs and macroalgae, while the lagoon primary producers are microalgae and seagrass.
Within each of these zones there are different niches that can be occupied by various organisms and plants. This plethora of disparate environmental conditions allows for the incredible diversity found on reefs. Reefs on opposite sides of an island can have completely different structures. This is displayed wherever there is a prominent wind direction over an island or atoll. The windward side would have a large buttress, more defined spur and groove pattern, and a stronger reef crest. This is caused by an increase in wave action resulting in strong currents and greater overall water movement. On the leeward side the reef slope would be more gradual with the zonations being less defined (Odum1955). This is a result of less wave energy and calmer waters. Not only are there variations between the different zones of a reef but also in the direction it faces as well as its geographical location. This is why reefs are never identical in structure or biology.
Trophic Dynamics of reefs
The flora and fauna of coral reefs have very complicated associations that involve different ecological conjectures. The most integral of these is reef trophodynamics. This displays how various populations interact and is the foundation for the food web concept. This ecological model breaks down predator-prey interactions into basic levels. The first level is the primary producer (autotrophs). The primary producers are organisms that turn light energy into chemical energy and use it to build organic molecules, a process called photosynthesis. This process is the alteration of carbon dioxide and water with the energy of the sun to produce glucose and oxygen. It makes larger more complex compounds from smaller less energetic ones, the opposite of respiration. Autotrophs capture only about 1/2000th of the sun’s energy that reaches the earth’s surface (Garrison 1999). In coral reef systems the major primary producers are phytoplankton, bacteria, cyanobacteria and algae. These organisms are involved in complex relationships with other organisms that make up the reef community and are responsible for the paradoxically high productivity of these reefs in an apparent nutrient poor environment. To overcome this environmental deficiency coral reef systems create their own nutrients, through nitrogen fixing bacteria as well as primary production. However there is, a small nutrient influx into the system, from the open ocean because of this minor inflow even greater autotrophic production is possible. This locally created primary production on the reef is not entirely lost back to the ocean because of the biofiltering activity on phytoplankton, zooplankton, and dissolved organic matter which originates from both the pelagic and the reef zone. One of the major sources of organic material on coral reefs is the mucus secreted from coral polyps. It is estimated that corals spend 10-30% of their total photosynthetic production on these excretions, which provide a food for bacteria, microzooplankton and eventually filter feeders (Dubinsky 1990). These are the basic interactions that the trophic dynamics models.
Autotrophs only use the sun’s energy to create energetic compounds and are preyed upon by primary consumers, herbivorous fish, herbivorous molluscs, sea urchins, sea cucumbers, coral polyps and other large vertebrates and invertebrates (Birkland 1997). This is the second level of the trophic pyramid. The primary consumers (herbivores) are then fed upon by the secondary consumers such as corals, carnivorous fish and eels. This process progress until the apex consumer (top carnivore) is reached often in the form of a shark. (Garrison 1999). This, however is a quasi-cyclic process because the top carnivores eventually die and become food for decomposers. The decomposers are then eaten by one of the consumers. It is also not cyclic because jumps in trophic levels do occur and premature deaths also occur to organisms below the apex level. Each successive level has significantly less biomass then the one before it; this is why large numbers of producers and low-level consumers are needed to support apex predators because much of the energy is lost in the transfer from one level to another. There is very little energy wasted in this process except for that needed by each individual organism, such as respiration and food capture. The overall flow of energy through the system is very orderly.
As with any model of a natural phenomenon, trophodynamics is not a perfectly circular cycle. There are also carnivorous organisms that seem to have a primary production component. An example of this is the symbiotic relationship between corals and zooxanthellae. Corals are producers, herbivores, and carnivores all at the same time (Odum 1955). This is why coral can exist in an apparent ecological desert. They are nearly self-sufficient self-contained communities.
Significance of Coral Reefs
Coral reefs have been termed the “rain forests of the sea”. Like terrestrial rain forests, they support an enormous amount of biodiversity, rapid nutrient recycling, many forms of symbiosis, and a layered structure of canopy, under-story, and surface (Jaap 2000). These are only some of their many similarities. Since very little is known about exactly how all the organisms and processes function on a coral reef it is very important that they be protected so invaluable information is not lost forever. One commonly used example showing the need for reef research is the search for new pharmaceutically active compounds produced by reef organisms such as, the cone snails of Australia who’s poison is being used as a powerful non-addictive pain killer (Barinaga 1990). The demise of reefs may cause the loss of potentially useful products that could aid in the fight against many human and animal diseases. Other benefits of reef research are shoreline protection, fisheries, aesthetic wonder, and tourism (Jaap 2000).
Coral reefs protect coastlines in many ways, the major one being dissipation of wave energy (natural breakwaters). This is especially important during strong storms. Large waves produced by strong winds can seriously flood and erode an unprotected coastline. Coral reefs are also the cornerstone of some national economies. They not only provide good substance fishery resources but they can generate tourism dollars. Some countries such as Japan are taking steps to enhance their fisheries by huge artificial reef projects.
Threats to Coral Reefs: An endangered ecosystem
There are many serious threats to coral reefs. Large storms can break off unprotected colonies and the resulting rubble may cause further destruction. Wave action can also re-suspend particulates causing greater turbidity. Suspended particles eventually fall out of the water column. This is known as sedimentation. Turbidity decreases the amount of sunlight reaching the coral polyps and sedimentation causes the polyps to produce mucus to avoid burial and abrasion. This causes stress and makes corals more susceptible to disease and over-growth by fast growing algae and sponges.
Humans also are causing the degradation of coral reefs by using destructive practices. Some fishing practices are very harmful, including cyanide and blast fishing for the aquarium and restaurant trade. Cyanide is used to stun fish for easy live capture. However cyanide is a pollutant that kills the coral polyps with which it comes in contact. Fish captured by this technique have a shortened life span. When fish are squirted with cyanide they normally flee into a crevice in the reef which has to be pried apart to get the stunned prey. Blast fishing uses explosives to kill fish which are picked up when their bodies float to the surface. In the process the reef near the blast is also destroyed. Coral reef mining is another problem. This entails blowing up the carbonate reef and using it for construction purposes.
Terrestrial pollution is another serious problem near large urban centers. Sediment from land clearing operations can reach the ocean in runoff. Other problems are over-fishing, poorly managed tourism and global climate change. Accidental human errors, such as ship groundings, cause further damage to the coral reefs.
Groundings have been a significant problem in Florida. Often when a ship runs into a reef it will crush the reef, excavating sediments and rubble leaving a berm of material behind the ships resting position. There are various strategies for dealing with this ecological mishap. They include cementing the rubble in place so it can do no more damage, and collecting and reintroducing specimens of sponges and corals because most sponges or corals if left on the ground for several days will die. Other strategies involve moving the rubble to deep water and dumping or piling it into mounds off the reef. After the rubble is removed or solidified an artificial reef structure is placed in the damaged area and the collected specimens are attached to the new surface (Jaap 2000). In attempts such as these to return coral reefs to their natural state the use of artificial reefs has been employed.
There are no fully developed reefs in the Sarasota area because it is located at the northern limit of tropical coral growth. However, there are locations north of Sarasota that sustain large reefs such as the Flower Banks in the northern Gulf and Bermuda off the Carolinas. These abnormalities are simply the result of warm water currents. The loop current that warms the Flower Banks is the same current that passes the West central Florida coast however this current travels clockwise along the coast of Mexico, Texas and then Florida. When it reaches the Sarasota area it occasionally drops below the 18°C zooxanthellae exclusion zone. Temperature is a major factor that shapes the reef communities in this area. An additional factor limiting natural reefs is the lack of hard substrate. Artificial reefs have been deployed to address this deficiency and for an abundance of other concerns. Reefs in this area are made from barges, tires, demolition debris, PVC structures, and Bay BallsÔ. These reefs are not made to mimic natural reefs in topography or structure but they do attempt to create a colonization community that will allow for some of the economically and biologically important organisms to thrive by constructing the lowest trophic levels. Artificial reefs are occasionally deployed to return a disturbed area to a more natural state, this is the case at several sites in Sarasota Bay.
Artificial Reefs
“An artificial reef is one or more objects of natural or human origin deployed purposefully on the sea floor to influence physical, biological, or socioeconomic processes related to living marine resources. Artificial reefs are defined physically by the design and arrangement of materials used in construction and functionally according to their purpose. Items used in reef construction add vertical profile to the benthic (sea floor) environment” (Seaman 2000).
Construction materials used for artificial reefs are either collected after being used for some other end or designed specifically for artificial reef deployment.
“The building of artificial reefs goes as far back as the 1790’s in Japan when fisherman placed large wooden bamboo frames to increase catches” (Pickering 1996). In the United States the first artificial reef was constructed off the South Carolina coast in 1830 of fallen pine and live oak trees (Weisburd 1986). These reefs were constructed solely to increase fish catches. Today that is still the driving factor for artificial reef deployment but other reasons have developed. These reasons include assisting fishing concerns such as, hook-line, spear, artisanal, commercial fisheries as well as to control fishing mortality along with other aquaculture production sites. Other factors driving the creation of artificial reefs are recreational skin diving sites and submarine tourism sites. Conservational concerns include manipulating organism life history, habitat protection, conservation of biodiversity, mitigation of habitat damage and loss, restore or enhance water and habitat quality, and research purposes (Seaman 2000). It has long been known that fish are found in greater abundance near areas with a changing sea bottom. Consequently, some of the major functions of artificial reefs are to: “aggregate organisms to enable more efficient fishing, increase natural productivity by providing new habitats for encrusting organisms which contribute to food chains, create habitat for desired target species, and protect juvenile organisms and nursery areas from destructive fishing gears” (Chou 1997).
Artificial reef structures have been used to fill in the areas excavated by ships and give back a more natural topography to these areas. However, these patch jobs will never truly fix the ecological damage but can mitigate the impact by bringing back some of the natural processes. It can reintroduce a primary production community by creating a substrate. Depending on the design of the structure it can give back some of the reef’s natural complexity. It is impossible to duplicate all the different processes and complex relationships that occur on natural reefs. However, some artificial reefs are designed with specific goals in mind such as to create habitat for reef creatures as well as to provide a substrate for reef fouling communities, which create a food source for primary and upper level consumers. In this limited sense they do mimic the processes of trophic dynamics that occur on natural reefs but they do not have the same level of complexity in structure or diversity.
Artificial reefs are primarily made from materials of opportunity in the United States. Several questions arise because of the use of these materials. Do construction practices where waste materials are used qualify as artificial reef development or simply as dumping of these wastes? Moreover, is it a reef or is it simply an abnormality on the sea floor? Many different materials have been used such as: cars, boats, airplanes, tanks, tires, appliances, oilrigs, and demolition articles. It is often much cheaper to just dump these materials in the ocean than dispose of them in a landfill. “Some scientists worry that reefs made from surplus materials might contribute to ocean pollution and destroy natural fish habitats” (Weisburd 1986). Materials used to make artificial reefs must be thoroughly cleaned to eliminate pollutants. They also have to be heavy enough not to be moved during storms and be made out of materials that will not corrode and collapse. Many of the reef structures built in the early 1900’s were “hit or miss” dumping operations to get rid of unsightly scrap materials (Pickering 1996).
Today’s artificial reefs are designed with particular purposes in mind. Despite the initial cost involved with the use of dedicated artificial reef structures and materials, it is evident that to maximize the potential of artificial reefs they must be designed to fulfill certain objectives (Pickering 1996). The first consideration an engineer must take into account is; will the structure withstand the fall to the bottom? Once in place will it withstand the stresses of currents, burial and storms (Weisburd 1986)? If the reef is placed in an area of strong currents such factors as scouring must be taken into account along with the potential of movement of the reef. Scouring under the edges of artificial reefs can result in the burial of the reef. It can also result in good burrows for cryptic species around the base of the reef (Seaman 2000). The movement of artificial reefs can destroy the area around the reef as well as the artificial reef itself. Therefore, the design of a reef is critical to the survival of the structure and presence of desired species (Pickering 1996). The stability and complexity of artificial reefs determines the amount of fouling (organisms attached to the substrate) and numbers of resident species. The more complex the structure, the more diverse the resulting community will be. The spatial arrangement, number, and size of openings will determine the types and numbers of organisms present (Chou 1997).
Many different materials have been used to create artificial reefs such as: tires, wood, concrete, PVC, fiberglass, plastic, metal, pulverized coal ash, and marine alloys (Chou 1997). The use of these materials varies in different parts of the world. In Europe and Japan the dominant material is concrete. Japan also uses steel and fiberglass. Tires are used in countries that have poor artificial reef management programs. In Australia, Jamaica, and the Philippines, tires are considered non-toxic durable materials. The United States and Europe view tires as a source of pollutant leaching, however, the United States nevertheless continues the predominate use of other materials of opportunity (Pickering 1998).
There has been a serious shift worldwide towards using materials dedicated solely for the creation artificial reefs. This allows for better designs and more effective reefs. They can be specifically designed for a single purpose such as to protect shorelines or any other of a multitude of objectives. Concrete has been found to be very favorable for artificial reef construction. It does not degrade in seawater, can be made to have neutral pH, is easily molded, not easily moved once in place but hard to transport to the deployment site. Concrete can be made to have a texture comparable to natural reefs and develops very similar communities as natural reefs (Pickering 1997). PVC and other plastics are also very moldable, do not degrade, are easily transported, but are not as stable due to their lightness and are typically smooth textured (Bortone 1994). An important feature of steel is that it can be made into very complex structures. It is also very heavy and not easily moved by wave action but does corrode in seawater. Each of these materials has benefits and drawbacks.
The environment of the deployment area determines the materials to be used. Artificial reefs at great depths or in protected areas with weak currents do not need to be incredibly stable. However, the greater the amount of wave action and current the more stable the reef must be to withstand having its structural integrity compromised. The seafloor’s bearing capacity, compressibility and soil strength also influence the design characteristics of the artificial reef (Seaman 2000). If the ocean bottom were made of a thick layer of fine sediment a heavy reef would sink and disappear into the bottom (Culter 1997). In this situation lightweight reef construction materials should be used.
The shape and size of reefs also influences the physical characteristics of the surrounding area, most notably the currents around and through the reef. When an artificial reef is placed in the path of a current, it displaces the current to varying degrees depending on the porosity of the structure. In the water behind such a reef there will be a shielded locale of little or no currents. This can attract fish by giving them an area where they do not need to fight a constant current. This area may produce pressure fluctuations associated with turbulence, which can also stimulate fish aggregation (Nakamura 1985).
It has been found that different sized reefs have different population characteristics. “Several studies have identified that reef size significantly influences the biomass and the total number of species and individuals, with the efficiency of artificial reefs as attractors being far greater when formed into a structure than disaggregated into pieces” (Pickering 1996). It also follows that more complex reefs are better attractors. In a different study it was found that several smaller, but just as complex, artificial reefs have more associated individuals and species than a single larger complex reef. This may be because a more spread out reef has the potential for a greater number of different niches due to a larger area covered. “Reef size significantly influenced total numbers of species, individuals, and biomass. Smaller reefs had greater fish density while larger reefs had higher biomass density from larger, but fewer, individuals. Multiple small reefs supported more individuals and more species than one large reef of equal material” (Bohnsack 1994). This may be due to competition and predation of the smaller individuals by fewer but larger individuals. It is also believed that smaller reefs are better at recruiting because they cover a greater horizontal swath of the seafloor (Pickering 1994). In Bohnsack’s 1994 study larger reefs were found to be better for supporting fisheries while many smaller reefs promote greater diversity through recruitment. The more dispersed the reef material is the greater the horizontal spread will be and thus the greater the attraction capacity will be for settling organisms.
Size is an important attractant of migratory species. The height and width act as visual or audio reference points. Certain organisms such as benthic species occur in greater numbers when the reef bottom area is larger while height does not affect their numbers. Mid-level species prefer reefs with a greater vertical profile. The size of a reef may also affect the temporal scale at which it reaches a state of equilibrium and similarity to other nearby artificial reefs. It has been found that assemblages on larger artificial reefs become significantly similar after 2 years but smaller reefs become quite comparable after only 12 weeks of submergence (Tupper 1998). The age of an artificial reef can determine the type of communities one is likely to find. These initial communities rapidly change during colonization and succession periods.
Many studies have been conducted to determine when communities on newly placed reefs have reached a point of equilibrium. This ecological stability seems to be reached after two to three years (Coll 1998 & Ardizzone 1989). In a five-year study conducted on the epibenethic community on a new artificial reef deployed in the Mediterranean Sea, three phases of colonization were identified. The first phase was the ‘pioneer settlement phase.’ This phase was mainly dominated by diatoms, hydroids, and juvenile mussels. This lasted for six months. The next phase, the ‘mussel dominance phase’ lasted for two years. The final period was known as the ‘regressive period.’ It is an alteration of the substrate by soft sediments and an increase in species diversity (Ardizzone 1989). “As habitats accumulate species, the initially high rate of colonization falls, and some colonists become locally extinct. The rate of local extinction increases until the colonization and extinction rates are approximately equal, resulting in an approximate species equilibrium” (Pratt 1994). After this time there are only cyclic changes in species composition. Non-cyclic changes no longer occur because the resulting community is in equilibrium. This is due to niche partitioning. One organism may be better adapted for a particular locale on the reef than the original pioneer species. So until the environmental factors change, it will out compete and displace the original organism and other potential inhabiters as well. This is typical of colonization of an artificial reef. Habitat choice is probably a determining factor of larval settlement in structuring the community but this is changed over time as the reef evolves. “Seasonality has been observed to be the second major factor to affect the quantitative species composition of assemblages” (Coll 1998). The effect of seasonality however, seems to be mitigated in the course of a year. Artificial reefs that were created at different times, over the course of a year, become essentially the same after they have all been in the water for at least a year. This may be because the different seasons allow different colonists to occupy the reefs.
vs.

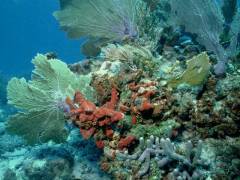
Figure 1&2. Artificial versus natural reefs.
Artificial vs. Natural Reefs
After several years submerged artificial reefs start to take on many characteristics of natural reefs such as a large primary production capacity. This leads to many different questions namely the artificial reef versus natural reef production hypothesis. The hypothesis is actually a comparison of the trophic production capacity of artificial reefs against natural reefs. When artificial reefs are deployed the initial colonization is also the beginning of primary production, the base of the energy pyramid. The energy from primary production can progress up trophic levels to commercially important organisms. Interests concerned with ways to increase catches of these important organisms are the primary funding source for studies on artificial reefs.
Several different studies have found higher catch rates of fish at artificial reefs than at control sites around the world. This includes observations off the coast of Sicily where catch rates were comparable between an artificial and a natural reef but the total weight of the catches on the artificial reef was always higher (Fabi 1994). “Over time, the occupancy of artificial reefs has been demonstrated to approximate or exceed those of natural reefs in the neighboring vicinity, largely irrespective of reef type” (Pickering 1997). A study conducted off Miami, Florida found that “fish and biomass densities were higher at artificial reefs than on surrounding sand and natural reefs” (Bohnsack 1994). These studies suggest that artificial reefs are just as good or better than natural reefs at either supporting or attracting fish. However it is difficult to determine why this might be the case. “For example, there is no way to discern (1) whether fishes that settle or that were attracted to the artificial reefs would have found suitable habitat if the reefs were not present; (2) whether fishes had better survival or faster growth at artificial reefs than in natural habitats; (3) whether foraging success and food web efficiency was improved by artificial reefs; and (4) whether habitat vacated by fishes moving to artificial reefs was reoccupied so that total population size increased” (Bohnsack 1994). This leads into the debate of attraction versus production on artificial reefs.
“It has long been known that pelagic fish are attracted to floating structures in the sea such as seaweed, logs, and other flotsam” (Friedlander 1994). Fish aggregating devices (FAD’s) are commonly used to increase fishing success. These are only structures to attract fish not to increase production. It is the opinion of many people that artificial reefs are nothing more than FAD’s. This however is not entirely correct because artificial reefs support many lower organisms that help serve as a food base for other resident species. Artificial reefs can increase production in many ways such as increasing habitat, shelter, and creating substrate. “The species most likely to benefit in terms of increased biomass are habitat-limited, demersal, philopatric, territorial and obligatory reef species” (Pickering 1997). “The effects of artificial reefs are more evident at sites far from natural hard substrates” (Bombace 1994). This is because it creates shelter for habitat-limited species. Artificial reefs are likely to increase habitat-limited species but not those that are recruitment-limited (Pratt 1994). Populations need not always lie at the carrying capacity of the environment hence habitat may not be the only limiting factor (Pickering 1997). Predation, fishing pressure or recruitment-limitation could be the limiting factor. In these cases artificial reefs can only alleviate predation by creating more shelter while, artificial reefs are unlikely to significantly increase population size of species that are recruitment-limited or subject to heavy fishing mortality (1997).
To determine the effectiveness of a reef at increasing biomass productivity one need only to look at the fouling coverage (low level production) on a particular reef. The greater the fouling coverage the more production capacity the reef currently has. The primary reason Bay BallsÔ have been deployed in Sarasota Bay is to increase the fouling community. However the amount and type of fouling coverage can be affected by many environmental factors such as: current, sedimentation, turbidity, depth, size, temperature, age and location.
The hypothesis to be tested in this thesis is that the environmental factors of current, sedimentation, temperature, depth, and turbidity (visibility) may have different effects on the biomass production of artificial reefs. The statement of purpose was to find which one or ones of these environmental factors contribute the most to determining the relative effectiveness of the different reef sites. Accordingly, artificial reef units, Bay BallsÔ, were selected at sites where these factors differed and the fouling coverage was estimated.
Methods
Project Location
Figure 3. A Bay Ball covered with growth in Sarasota Bay
Five sites in Sarasota Bay were purposefully selected for this
research project. These sites were chosen on the basis of their proximity to
each other, as well as their varying environmental conditions. The sites
consist of collections of Bay Ballsä,
which are smaller versions of Reef BallsÔ, the most widely used prefabricated artificial reef
design in the world. These concrete structures are hemispherical, three feet in
diameter by two feet high, with heavy bottoms and an opening on top, which aids
in resisting lifting forces during storms. It has been projected that these
structures will last for over 500 years in saltwater because they are made from
marine concrete with microsilica. The outside of Bay Ballsä are
textured and of neutral pH to allow for improved colonization. Bay BallsÔ have
a hollow interior and the external wall is perforated with holes of different
dimensions to attract fish of different sizes, and to provide many escape
routes. The holes are also “vortexed” to create whirlpools for filter feeding
organisms. These holes are cone shaped with an aperture widening toward the
inside, which facilitates water rotation. The configuration of these Bay Ballsä on
the seafloor is different at each study site. The five sites are Gerkin, Hart,
Jantzen, Saprito, and Walker.
Study Area![]()
![]()
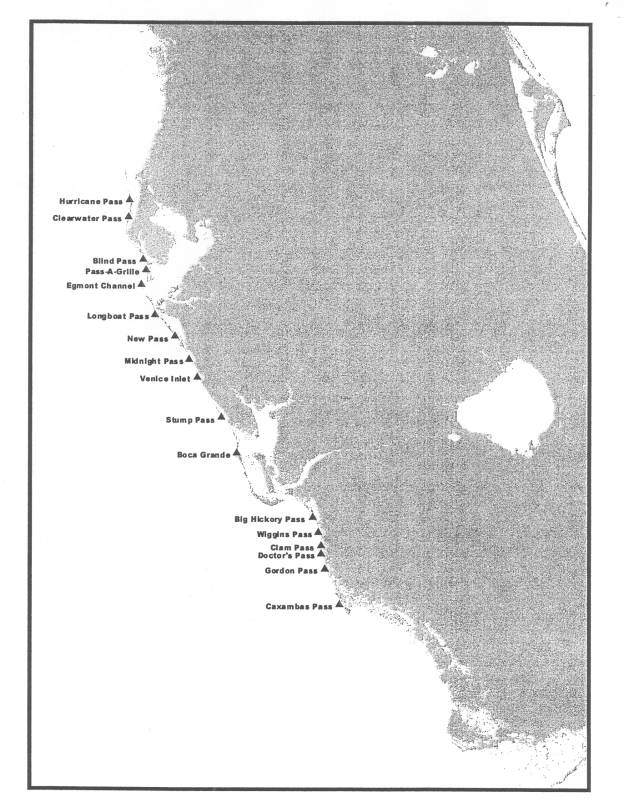 Figure
4. Passes on the West Coast of Florida and study area.
Figure
4. Passes on the West Coast of Florida and study area.

![]()
![]()
![]()

Figure 5. Location of artificial reefs in Sarasota
Bay.
1. The Gerkin site was deployed on November 12 and 13, 1999. It is made up of 40 Bay Ballsä, 3 PVC Reefs, and 3 PVC modules that are all tied together. The site is an old dredge hole located in 2.4-4.6 meters of water. Since it is a dredge hole near the bottom there is very little current so it has accumulated fine sediment. The light PVC reefs were used to create a large vertical profile while at the same time being light enough to avoid sinking into the soft bottom of the dredge hole. It is an unmarked site therefore there is little fishing pressure, but there are occasionally many crab traps.
2. Hart reef was deployed September 23 and 24, 1997. It is made up of 125 Bay Ballsä in 3.0 meters of water and was marked by a piling but the piling was broken due to bad weather in March and is now marked by a buoy.
3. The Jantzen site was deployed on September 25 and 26, 1997. It is made of 120 Bay Ballsä in 3.7 meters of water and is marked by a piling.
4. The Saprito site was deployed on September 22-29, 1998. It is made of 150 Bay Ballsä in 1.8-3.0 meters of water. The balls were placed around the edge of a fishing pier to increase the local fisheries. The particular ball that we monitored at this site was designed with a plastic mesh inside to aid in juvenile fish survival. During the first dive at this site it was determined that the plastic mesh seemed to have functioned as a sediment trap and then collapsed under the weight of the accumulated deposit leaving behind a regular Bay Ballä with a layer of sediment on the bottom.
5. Walker reef was deployed on October 10, 1999. It is made out of 4 feet by 8 feet slabs with 7 Bay Balls on each. There are 20 slabs for a total of 140 Bay Ballsä. Walker covers a very large area, is located in 3.7 meters of water and is an unmarked site.
Figure 6. Bay Balls in
Sarasota Bay.
Table
1.
Date, Size, Depth, and Fishing Pressure of the Reef Sites
|
|
Deployed |
# of Balls |
Depth (m) |
Marked Site |
|
Gerkin |
Nov. 99 |
40 |
2.4-4.6 |
no |
|
Hart |
Sept. 97 |
125 |
3.0-3.7 |
yes |
|
Jantzen |
Sept. 97 |
120 |
3.0-3.4 |
yes |
|
Saprito |
Sept. 98 |
150 |
1.8-3.0 |
yes |
|
Walker |
Oct. 99 |
140 |
3.0-3.7 |
no |
The Gerkin and Walker sites
are unmarked, therefore, there is no fishing pressure because their coordinates
are unpublished. Bay Ballsä
were set up in a different configurations at each of these sites. The Gerkin
site is more randomly laid out because there was no original design plan so it
is not shown below. The Bay BallsÔ
were haphazardly dropped in a large designated area. Jantzen
Reef Hart
Reef
30 25 22 Balls
![]()
15 Balls
![]()
![]() North
North
Saprito
Reef Walker
Reef 35


![]()
![]()
Figure 7. Design plan of Hart, Jantzen, Saprito, and
Walker reefs. The gray balls are the principal ones studied.
Materials
A Global Positioning System (GPS) and sonar were used along with scuba gear to locate the reef sites. Another important instrument used was an orange along with a digital watch to measure current. We placed specially designed traps to collect sediment samples. These traps were made of different diameter PVC pipe stacked and glued together in a circular arrangement with a sediment bag duct-taped to the bottom. They each had an attached metal rod that was stuck into the sea bottom for support. An underwater thermometer was used to measure the bottom water temperature at each depth. A simple scuba depth gauge was used for underwater depth measurements. To capture images of the reefs, a Hi-8 underwater video camera was used with a monitor and a VCR to view the videos and estimate coverage. We measured visibility with an eight-inch secchi disk and tape measure. We collected bottom samples in film canisters. A series of five nested sieves were used to separate the different grain sizes and each group was weighed.
Field Methods
Since each of these sites has different environmental factors influencing their flora and fauna, we measured several factors including: current, sedimentation, temperature, depth, visibility (turbidity), fouling coverage, and bottom sediment type.
Current
We used a float (orange) to measure current. We would release it and then time it for one minute and measure the distance it traveled. This was done three times at each site to minimize error. This was an easy way to determine the average surface current at each site.
Sedimentation
We planted sediment traps near the base of haphazardly selected Bay BallsÔ, in an area of penetrable sediment. When they were collected, the whole trap was taken and carried upright to the boat, sealed and labeled.
Temperature
Temperature was collected in two ways, either by an underwater thermometer attached to a BC or by the dive boat’s computerized sensor. Both readings were essentially the same with a maximum of one-degree Fahrenheit difference, since the boat’s sensor was at the depth of the draft of the boat (1m) this water was not heated to the same extent as the surface. All readings, surface to bottom were taken at the same position and were essentially the same.
Depth
The water’s depth was similarly measured in two ways. Our dive computer was set on the bottom to determine depth and the boat’s depth finder confirmed these measurements.
Visibility
Two divers using an 8-inch secchi disk measured the turbidity horizontally at the reef’s depth. This was the first thing done on every dive to avoid skewing the data by disturbing the bottom sediments.
Fouling
Coverage
The average coverage was estimated for each site from five haphazardly selected balls. A side was haphazardly chosen and visually split to four parts and coverage was estimated in each of these quadrants. This was normally the side first encountered when coming upon the site.
Using underwater videotapes and photographs of the Gulf of Mexico site (see appendix A) the amount of fouling coverage and diversity was estimated back at the lab using a monitor.
Bottom
Sediment
Bottom samples were taken using a film canister near the base of a Bay BallÔ. The canister was pressed straight down into the bottom sediment and a hole was dug by hand next to it. The cover was slid on and secured to preserve the integrity of the sample.
Laboratory Methods
Sedimentation
In the laboratory the samples were
dried in a hood (usually 3 to 4 days), until no apparent moisture was left and
weighed. The weights were then divided by the number of days they were in the
water to determine the average daily sedimentation for each site. The grains
collected in the sedimentation traps were all of similar size, in the fine
sand/clay range.
Bottom
Sediment
The samples were taken back to the lab, dried and then passed through a series of five Hubbard Scientific Company nested sieves. From this the relative amounts of the different particle sizes were determined by weight. The particle types and percentages were then determined and labeled according to the Wentworth classification.
Figure 8. Wentworth Classification system.
|
Particle
Size Class |
|
|
Grain
Size (mm) |
|
Gravel |
|
|
>
2.0 |
|
Very
course sand |
|
|
>
1.0 < 2.0 |
|
Course
sand |
|
|
>
0.5 < 1.0 |
|
Medium
sand |
|
|
>
0.25 < 0.5 |
|
Fine
sand |
|
|
>
0.125 < 0.25 |
|
very
fine sand |
|
|
>
0.0625 < 0.125 |
|
Silt/
clay |
|
|
<
0.0625 |
The majority of the variables in this study are not independent. In fact many are interrelated. Figure 9 shows how these variables interrelate.
The goal of this study is to determine which factor or factors has the greatest correlation to fouling coverage. Thus which one has an arrow leading to fouling coverage.
![]() Independent Variables- Size Depth
Independent Variables- Size Depth
![]()

![]()

![]() Dependent
Variables- Current
Dependent
Variables- Current
![]()
Sedimentation
![]()
![]() Temperaure
Temperaure
Bottom
![]() Sediments Visibility
Sediments Visibility
![]()
![]()
![]() ?
? ?
?
? ?
Fouling Coverage
Figure 9. Dependency
between the study variables.
The null hypothesis, there is no notable relationship between any of the environmental factors (current, sedimentation, temperature, depth, and visibility) and reef success (fouling coverage).
Alternative hypothesis, there is a relationship between the environmental factors (current, sedimentation, temperature, depth, and visibility) and reef success (fouling coverage).
The environmental factors that appear to have a correlation will be put through a multiple regression test. If this shows that there is no significance then the null hypothesis will be supported. Conversely, if there is a correlation then the alternative hypothesis is supported.
Results
Fouling Coverage
The estimate of fouling coverage was completed on April 24, 2001 the Jantzen reef had the greatest average fouling coverage of 84%. Walker with (80%), Saprito (77%), Hart (71%), and Gerkin with the least coverage (40%) followed it. The average coverage was computed for each reef by summing the percent cover of each of the twenty quadrants and dividing by the number of the summed quadrants. The values for each sites quadrants are shown below. The ordinal value of fouling coverage was statistically tested for correlations against all the environmental factors except bottom sediment and sedimentation.
Table
2.
Fouling Coverage
at Jantzen Reef in Percent
|
Bay Balls |
Top/Right (%) |
Coverage Quadrant Top/Left (%) |
Bottom/Right |
Bottom/Left |
TotalAvg. % |
|
|
1 |
70 |
50 |
50 |
50 |
|
|
|
2 |
100 |
90 |
100 |
90 |
|
|
|
3 |
100 |
100 |
100 |
90 |
|
|
|
4 |
100 |
100 |
90 |
90 |
|
|
|
5 |
80 |
80 |
70 |
90 |
84 |
|
Table
3.
Fouling Coverage
at Walker Reef in Percent
|
Bay Balls |
Top/Right (%) |
Coverage Quadrant T/Left (%) |
Bottom/R |
B/L |
TotalAvg. % |
|
|
1 |
60 |
90 |
80 |
70 |
|
|
|
2 |
90 |
60 |
90 |
70 |
|
|
|
3 |
70 |
90 |
60 |
60 |
|
|
|
4 |
80 |
100 |
60 |
90 |
|
|
|
5 |
100 |
90 |
80 |
100 |
80 |
|
Table
4.
Fouling Coverage
at Saprito Reef in Percent
|
Bay Balls |
Top/Right (%) |
Coverage Quadrant T/Left (%) |
Bottom/R |
B/L |
TotalAvg. % |
|
|
1 |
90 |
90 |
70 |
90 |
|
|
|
2 |
70 |
70 |
80 |
80 |
|
|
|
3 |
60 |
80 |
50 |
60 |
|
|
|
4 |
80 |
90 |
70 |
80 |
|
|
|
5 |
90 |
90 |
80 |
70 |
77 |
|
Table
5.
Fouling Coverage at Hart Reef in Percent
|
Bay Balls |
Top/Right (%) |
Coverage Quadrant T/Left (%) |
Bottom/R |
B/L |
TotalAvg. % |
|
|
1 |
50 |
30 |
40 |
70 |
|
|
|
2 |
80 |
90 |
90 |
80 |
|
|
|
3 |
90 |
80 |
90 |
100 |
|
|
|
4 |
100 |
90 |
100 |
70 |
|
|
|
5 |
40 |
50 |
30 |
40 |
71 |
|
Table
6.
Fouling Coverage at Gerkin Reef in Percent
|
Bay Balls |
Top/Right (%) |
Coverage Quadrant T/Left (%) |
Bottom/R |
B/L |
TotalAvg. % |
|
|
1 |
50 |
60 |
60 |
70 |
|
|
|
2 |
20 |
50 |
30 |
40 |
|
|
|
3 |
30 |
50 |
60 |
40 |
|
|
|
4 |
50 |
20 |
30 |
40 |
|
|
|
5 |
50 |
20 |
40 |
30 |
40 |
|
Current
Three
surface current measurements were taken for each of the sites on April 8, 2001
and averages were computed. The Walker site had the slowest average current 4.1
m/min. This was anticipated because the Walker reef is located in a broad deep
part of the bay. The Walker site is also centrally located between Longboat and
New Pass. “Currents in areas between the passes, of Sarasota Bay, are generally
much weaker than currents in the passes due to null zones (areas of little
water movement)” (Alderson 1992). Bernoulli’s Principle of fluid dynamics would
predict similar findings. As a fluid in motion is squeezed through a smaller
area its velocity is forced to increase. The Gerkin site is the next slowest,
with an average current of 6.2 m/min. This site is located in a dredge hole; as
a result the reef is in deeper water than the relatively shallow surrounding
area. The Hart reef has a current of 7.1 m/min. It is located in relatively
deep water but is closer to New Pass than Walker. The second fastest average
current is at Jantzen this is due to the bottleneck caused by Bird Island,
however Jantzen is located in deep water so this slows the current. Saprito
pier has the fastest average current of any of the sites 11.9 m/min. It is
located in the bottleneck caused by Ringling Causeway, but it is in very
shallow water, which increases the current speed. The values obtained for
current and their averages are shown below. These values collected as well as
all the values for most of the other environmental factors were statistically
tested for significance against fouling coverage. The test revealed that there
was no significant correlation between fouling coverage and current.
Table
7.
Current
(m/min) and the Averages at each Site
|
Measurement (m/min) |
Gerkin |
Hart |
SitesJantzen |
Saprito |
Walker |
|
1 |
6.4 |
6.1 |
12.2 |
12.8 |
4.3 |
|
2 |
6.7 |
9.3 |
5.5 |
12.8 |
3.7 |
|
3 |
5.5 |
6.1 |
7.9 |
10.1 |
4.3 |
|
Average |
6.2 |
7.1 |
8.5 |
11.9 |
4.1 |
Temperature
The five sites showed little or no variation in temperature due to the proximity of the sites. They are all relatively close together so there will intrinsically be very little variation between these sites because they are not isolated from one another and there is nearly constant water motion in these areas. The temperatures at each of the sites were not varied enough to influence fouling coverage. The statistics run on temperature displayed no significant correlation to fouling coverage. Each of the three groups of temperature measurements were taken during a different month, November, December and April. The values obtained for temperature and their averages are shown below.
Table
8.
Temperature (°F) and the Averages at the Reef Sites
|
Measurement (F) |
Gerkin |
Hart |
SitesJantzen |
Saprito |
Walker |
|
1 |
65 |
65 |
66 |
65 |
66 |
|
2 |
63 |
64 |
64 |
64 |
62 |
|
3 |
75 |
75 |
76 |
75 |
76 |
|
Average |
68 |
68 |
69 |
68 |
68 |
Visibility
Similarly, the visibility differences between the sites are small. However, the measurement of visibility had a slightly larger variation between the sites than the temperature measurements. Each of the data collections for visibility were taken at least two weeks apart and averages were also computed for each site. The values obtained for visibility and their averages are shown below. There was no statistical correlation to fouling coverage found.
Table 9.
Visibility (m) and their Averages at the Reef Sites
|
Measurement (m) |
Gerkin |
Hart |
SitesJantzen |
Saprito |
Walker |
|
1 |
1 |
1.1 |
1 |
1.1 |
1.2 |
|
2 |
1.2 |
0.8 |
1 |
1.1 |
0.8 |
|
3 |
0.7 |
0.5 |
1.2 |
0.8 |
1.2 |
|
4 |
0.8 |
0.8 |
1.4 |
0.8 |
0.8 |
|
Average |
0.93 |
0.8 |
1.2 |
0.95 |
1 |
Age
The oldest site is Hart it was deployed September 23 and 24, 1997. Jantzen reef was created over the next two days the 25 and 26 of September. The Saprito pier site was the next completed in September 1998. The Walker site was the next deployed in October 1999. The following month the Gerkin reef site was deployed. No statistical correlation between fouling coverage and age was revealed.
Depth
The depths of these reefs vary over the large area covered by each site. This is the reason it is hard to get an ordinal depiction of the relative depth at each of these sites. However we do know that Saprito pier site is the shallowest site 1.8-3.0m. While Gerkin reef is in and on the side of a dredge hole giving it the large variation in depth 2.4-4.6m. The other three sites Hart, Jantzen, and Walker all have essentially the same depth from 3.0-3.7m. Depth and fouling coverage showed no statistical correlation.
Sedimentation
The measurement of sedimentation is incomplete due to the many problems encountered. However the insufficient data collected on it is displayed in Table 10. Since the data is incomplete no tests for correlations were performed.
Table
10.
Incomplete Data
Collected on Sedimentation (g/day)
|
Set (g/day) |
Gerkin |
Hart |
SitesJantzen |
Saprito |
Walker |
|
1 |
|
2.7 |
4.4 |
5.2 |
|
|
2 |
|
|
|
5.6 |
|
|
3 |
5.9 |
9.7 |
|
5.9 |
4.8 |
Bottom Sediments
The Saprito site had by far the largest bottom sediments. It was followed by Hart, Jantzen, Walker, and Gerkin with the finest particles. This seems to relate to what was found for surface current velocity. The Saprito site had a significantly faster current 11.9m/min than the other sites so it would correspondingly have larger sediments that could not be easily moved. The currents at Hart and Jantzen are comparable 7.1 and 8.5 m/min correspondingly they have similar sediments. The Walker reef had relatively fine sediments because it is in an area of slow currents allowing small particles to settle out. The Gerkin site had the finest bottom sediments because it is located in a dredge hole. Dredge holes are known to collect silt size particles because of little water movement at the bottom of the hole (Culter 1997). The average values of the five sediment types at each reef site are shown below. It would be inaccurate to alter the data obtained into a form that can be statistically tested for correlations. Therefore, no statistical tests were performed on the bottom samples.
Table
11.
Averages of Bottom Sediment Types and
their % at the Reef Sites
|
|
Gerkin |
Hart |
Jantzen |
Saprito |
Walker |
|
Shells
(%) |
1.2 |
0.9 |
5.5 |
10.3 |
1.4 |
|
Very
coarse sand (%) |
0.9 |
23.2 |
8.9 |
18.8 |
1.7 |
|
Medium
sand (%) |
15.4 |
24 |
28 |
49.8 |
18.2 |
|
Fine
sand (%) |
80.6 |
20.4 |
57 |
20.8 |
78 |
|
Clay/Silt
(%) |
1.8 |
0.4 |
0.6 |
0.2 |
0.5 |
The averages of the environmental factors are all displayed in Table 12. Comparing fouling coverage to all the other factors in this table it is apparent that only visibility shows a possible correlation.
Table
12.
Averages of the
Factors at the five Study Sites
|
|
Fouling Coverage
(Ordinal) |
# of Balls |
Depth (m) |
Area (sq. km) |
Avg. Current (m/min) |
Avg. Temperature (F) |
Avg. Visibility (m) |
Age (Ordinal) |
|
Jantzen |
1 |
120 |
3.0-3.4 |
0.00093 |
8.5 |
69 |
1.2 |
2 |
|
Walker |
2 |
140 |
3.0-3.7 |
0.36 |
4.1 |
68 |
1 |
4 |
|
Saprito |
3 |
150 |
1.8-3.0 |
0.0015 |
11.9 |
68 |
0.95 |
3 |
|
Hart |
4 |
125 |
3.0-3.7 |
0.00093 |
7.1 |
68 |
0.8 |
1 |
|
Gerkin |
5 |
40 |
2.4-4.6 |
0.37 |
6.2 |
68 |
0.93 |
5 |
The following graph seems to suggest that a linear relationship exist between fouling coverage and visibility. However, this is not the case because the line of best fit for this graph (see Figure 10) has a slope of nearly zero this means no trend is present. This is confirmed by the statistics employed, which show visibility is insignificant.
Figure 10. Fouling coverage (ordinal)
vs. visibility (m).
To determine whether visibility, current, temperature, age, number of balls, area, or depth have a significant correlation to fouling coverage a multiple regression test was used. A computer program was employed for this.
Table 13.
Values Entered into Multiple Regression Test
|
|
Fouling Coverage (ordinal) |
Current (m/min) |
Temp. (F) |
Visibility (m) |
Age (ordinal) |
# of Balls (ordinal) |
Area (ordinal) |
Depth (m) |
|
Jantzen |
1 |
12.2 |
66 |
1 |
2 |
4 |
4 |
3 |
|
|
1 |
5.5 |
64 |
1.4 |
2 |
4 |
4 |
3 |
|
|
1 |
7.9 |
76 |
1.2 |
2 |
4 |
4 |
3 |
|
Walker |
2 |
4.3 |
66 |
1.2 |
4 |
2 |
2 |
3 |
|
|
2 |
3.7 |
62 |
0.8 |
4 |
2 |
2 |
3 |
|
|
2 |
4.3 |
76 |
0.8 |
4 |
2 |
2 |
3 |
|
Saprito |
3 |
12.8 |
65 |
1.1 |
3 |
1 |
3 |
1.8 |
|
|
3 |
12.8 |
64 |
0.8 |
3 |
1 |
3 |
1.8 |
|
|
3 |
10.1 |
75 |
0.8 |
3 |
1 |
3 |
1.8 |
|
Hart |
4 |
6.1 |
65 |
0.8 |
1 |
3 |
4 |
3 |
|
|
4 |
9.3 |
64 |
0.5 |
1 |
3 |
4 |
3 |
|
|
4 |
6.1 |
75 |
0.8 |
1 |
3 |
4 |
3 |
|
Gerkin |
5 |
6.4 |
65 |
1.2 |
5 |
5 |
1 |
4 |
|
|
5 |
6.7 |
63 |
0.7 |
5 |
5 |
1 |
4 |
|
|
5 |
5.5 |
75 |
0.8 |
5 |
5 |
1 |
4 |
This test compares fouling coverage to each factor individually and to every possible combination of factors. It also produces a correlation matrix (see Table 14).
Table 14.
Correlation Matrix for the
r-values of the Multiple Regression Test
|
|
Current |
Temp. |
Visibility |
Age |
#
of Balls |
Area |
Depth |
Fouling
Coverage |
|
Current |
1 |
-0.1381 |
-0.079 |
-0.2979 |
-0.026 |
0.3847 |
-0.6228 |
-0.0747 |
|
Temp. |
-0.1381 |
1 |
-0.0497 |
-0.0357 |
0 |
0.0454 |
-0.0174 |
-0.0535 |
|
Visibility |
-0.079 |
-0.0497 |
1 |
0.0802 |
0.1604 |
0.0681 |
0.0065 |
-0.0513 |
|
Age |
-0.02979 |
-0.0357 |
0.0802 |
1 |
0.2 |
-0.9701 |
0.4056 |
-0.5012 |
|
#
of Balls |
-0.026 |
0 |
0.1604 |
0.2 |
1 |
-0.2425 |
0.8922 |
0.3 |
|
Area |
0.3847 |
0.0454 |
0.0681 |
-0.9701 |
-0.2425 |
1 |
-0.5016 |
0.3 |
|
Depth |
-0.6228 |
-0.0174 |
0.0065 |
0.4056 |
0.8922 |
-0.5016 |
1 |
-0.4851 |
A correlation matrix calculates the direction and strength of the relationship between two variables. The direction is indicated by either a positive or negative correlation coefficient. The strength is indicated by how close the value of the correlation coefficient is to +1 in a direct relationship, and -1 in an inverse relationship. The table shows the correlations between all the pairs of the data.
The multiple regression test suggests that fouling coverage has a significant correlation to age, number of balls, area, and depth. Regardless, this is incorrect because these factors all have redundant values, which widen the confidence interval, thus detecting a correlation where there actually is none.
Discussion
Many of the environmental factors in this study are integrally related. These factors include sedimentation, visibility, and current. As current velocity increases sedimentation and visibility will decrease because the carrying capacity of the water column will likewise increase. The converse is also true. There are relationships between these many factors that are so intertwined and constantly changing that it would be very difficult to show any association. However, this was attempted for most of the factors in a multiple regression test.
Problems encountered
One of the major problems encountered was the inability to visit the site regularly, the loss of sediment traps, visibility and problems locating unmarked sites. Due to schedule conflicts sometimes the sites were not visited for well over a month. This would result in the loss of the data collection series for sedimentation by overflow, falling over, or disappearance of the traps. When the traps were down for relatively long periods of time they could fill completely with deposit. This would result in the dismissal of that data point. Other problems encountered were fouling over-growth on the traps that blocked sedimentation along with organisms such as Blennies, Blenniidae, which used the traps as a shelter and kept them from filling up with sediments. The longer the traps were submerged the greater the likelihood of disappearance. Some of them also disappeared after less then a week submerged. There are several potential reasons for this including strong currents, burial, or fisherman catching them. Once they were moved, since visibility was normally only three feet, they were impossible to find. To minimize this problem more stable traps able to resist the forces of currents should have been fabricated. Furthermore, several traps should have been placed at each site to assure a data collection point each dive. If it had been possible, a buoy would have marked the traps but since two of these sites are supposed to remain unmarked this was not an option.
Visibility also changed the way we were going to determine reef success. Originally fish counts were going to be the primary judgement of reef success but low visibility forced us to use sessile fouling coverage as the primary determinant. On many of our dives visibility was less then one meter. Visibility problems were encountered during other studies in the Gulf of Mexico, such as those by Sanders (1985) and Bortone (1994).
On one of the data collection trips our Global Positioning System (GPS) was reading the wrong numbers and giving an incorrect position for the Walker reef site; we were unable to locate the Walker site that day. One of the more interesting problems occurred when the research vessel sank and was out of service for several weeks. As a result of this sinking, the boat had chronic problems and needed constant repairs. This prolonged the data collection process by three months.
Design Concerns
The major concern of this thesis is the accuracy of the data collected since the sites were only visited a few times. To make the data collection complete and accurate the sites would need to be continually monitored by something such as a moored buoy (Bortone 1994).
Current measurements, for example, can be easily skewed. The current at each site was measured at the end of every dive. Since each of these sites are spaced approximately twenty minutes apart by boat and each dive takes nearly ten minutes, the time between the first and last current measurement on any particular dive was nearly three hours. During these three hours the currents can completely change in Sarasota Bay due to tidal or wind variations. To obtain an accurate depiction of the currents at each site a research buoy moored at depth would have to be employed that can continually take measurements. Sedimentation is much less affected by short-term variations due to the fact that its collection period is spread over many days.
The differences in temperature between the sites were so minute that it was impossible to determine if temperature had any effect on fouling coverage. Future research should monitor reefs in various locals to uncover the impact of temperature.
It was difficult to determine a definite percent coverage at each site. It was originally expected that the Bay BallsÔ would not be completely covered and have varying degrees of coverage due to the fact that they are in less then ideal conditions. However, nearly all the balls had a high percent of coverage. Because of this, it was hard to determine the small differences in the successfulness of each site.
Bottom sediment was also a concern because only three sub-samples were taken at each site. Different areas around Bay Balls could have completely different sediments due to differences in current velocity and shell deposition. However this unreliability was virtually eliminated by the fact that the three sediment samples were haphazardly taken at each site.
In future studies it may be useful to perform data collections at a greater number of reef sites to allow for more comparison. This would also allow for a larger n value in the statistical tests increasing the probably of finding significance.
Implications of the Findings
In the comparison of the number of Bay Balls to fouling coverage an interesting relationship was exposed. The Gerkin site, which has over a third fewer balls than the other four sites, has the least fouling coverage. This seems significant because there is over a thirty- percent drop in fouling coverage between Gerkin with 40.3% and the second lowest site Hart with 70.5%. The largest difference in percent coverage between any of the other sites is 6.5%. This suggests that the number of Bay Balls versus fouling coverage should be further accessed in future studies. This high amount of fouling coverage at each of the sites, with the exception of Gerkin, suggests that these reefs were appropriately designed and well placed to act as a base for primary production. However it is important to note that the Gerkin site is unlike any of the other sites due to the fact that it is in a dredge hole, is in the deepest water, and is the newest site. Any of these facts may account for the low fouling coverage.
These preliminary
averages suggest there is a positive relationship between fouling coverage and
visibility (see Figure 10), suggesting that turbidity is a factor limiting
primary production on these reefs. None of the other factors: depth, area,
temperature, and age seem to share a similar association with our estimate of
reef success (fouling coverage). There are several reasons for this. The
dependencies are too minute to be measured by our designs, the environmental
factors are entwined together, or there are no relationships and fouling
coverage occurs by chance.
The average visibility of the reef sites seems to be the closest to mirroring fouling coverage (see Table 12 and Figure 9). This association however, has one outlier represented by the Gerkin site. There are several possible reasons for this, the environmental conditions of the site as well as it being located in a dredge hole. The fact that it is in a dredge hole slows the currents passing over it allowing particulates to settle. The base of the dredge hole has a layer of silt particles that form a haze near the bottom from falling sediments. The column of water just above the haze is where we took the visibility measurements to avoid stirring up the bottom sediments. Due to this Gerkin may in fact have less average visibility then our measurements indicate. Other properties of the dredge hole such as depth or number of balls may have also contributed to its low fouling coverage.
The multiple regression test indicated age, number of balls, area, and depth all have a significant correlation to fouling coverage. However, this is misleading because the values of these factors all have redundancies. This makes the confidence interval very wide. In other words this is an inaccurate representation of the significance of these factors making this test inconclusive. There were not enough non-redundant values therefore the statistics could not draw a clear-cut conclusion.
To make this test representative of the actual significance of each of these factors more non-redundant data points would be to have to be collected. The data on visibility simply did not have sufficient data points. In future studies it would be suggested to have at least fifty non-replicated values for each of the factors of interest. There are indications that if a greater number of values were collected a correlation might have been found.
A Spearman Rank non-parametric Correlation test was run on the twenty values for visibility (m) versus the fouling coverage (ordinal) at each site. The correlation was found to be significantly different than zero with a two-tailed p = 0.0678, n = 20, considered not quite significant at a=0.05. If more values for visibility were able to be collected the confidence interval would have increased possibly making this test significant. In future studies it is suggested to compare 50 to 100 values of visibility to fouling coverage. In order make visibility significant with an n = 20, p would have to be 0.161. Conversely, with a p=0.0678, n would have to be 99. With more data points as well as more study sites future research should be able to determine if there is a significant correlation.
The first fouling community that appeared on our sediment traps were small worms. These were later succeeded by barnacles, which were in turn covered over by tunicates. The sea squirts bloom in Sarasota Bay during the spring and they cover all the available substrate. However during the course of a year they are consumed and out competed for space by other organisms. During our dives we observed a winter die off in the bay perhaps because this was a very cold winter. However, in spring a rapid recolonization occurred by algae, sponges, and occasionally corals, prior to the sea squirt bloom. Succession takes place during the year as well, when sea urchins feed they can entirely clean off Bay BallsÔ. The balls are covered by large amounts of algae that can be eaten by herbivores, this forms the beginning of the food web. Filter feeders are also well represented by some gorgonians, sponges, tunicates, and barnacles. The parts of the Bay BallsÔ not covered by growth are usually smothered with sediment ooze making attachment difficult for settling organisms.
Figure 11. Fouling Growth on a Bay BallÔ in Sarasota Bay.
Summary & Conclusion
The purpose of this study was to determine if there is a relationship between any of these factors: age, current, depth, sedimentation, temperature, and visibility, to fouling coverage. There was not a large amount of data collected due to the difficulties involved. Consequently no significant correlations were found. The data collected on the environmental factors such as age, current, depth, sedimentation and temperature all do not show a relationship. This could be for a plethora of reasons, my design to measure them may not have been sensitive enough or the variables could be too irregular over a period of only four months to show any relationship. The null-hypothesis was supported because the statistical tests used did not show a significant correlation between any of the environmental factors and fouling coverage. However, the correlation of visibility with fouling coverage was considered not quite significant. This suggests that in future studies more visibility data should collected to see if a correlation might be uncovered.
Appendix A
Gulf Site
On February 7, 2001 I was able to dive a site seven miles offshore Bradenton Beach. It is called 7-mile south reef. I joined a group of Manatee county employees headed by Bob Fluke of the Resource Management Division. During this dive we were to locate and count as many Bay BallsÔ as we could. We were able to locate 50 of them in two groups of 25. We tied a red ribbon to each one and then moved a rubber band from our left hand to the other to keep count. Only one ball was broken and it had occurred on the barge before it was deployed. This site was relatively young because it was deployed on June 2000 only eight months prior to the dive. However even though this was a new feature it was almost completely covered by growth and teeming with life. As we dropped on to the site there were huge schools of Yellow Jacks (Caranx bartholomaei). Growing on the balls were beds of tunicates, tunicata, macroalgae, stinging hydroids, Macrorhynchia philippina, and anemones, aiptasiidae. Also on the balls were sea urchins, star fish and arrow crabs. Inside the balls there were assorted size snappers.
This site is approximately 10 miles from the reefs in the bay and made out of the same substrate Bay BallsÔ. It is also a newer site then any of the ones in the bay. Due to the close proximity of this site and the bay reefs, it is interesting to compare them. The clarity of this Gulf site was really incredible nearly 25 feet but the water temperature was only 58°F at the reefs depth of 45 feet. This transparency of the water might explain the difference in coverage between this relatively new site and the bay ones. There are less suspended particulates in the Gulf than in the Bay. This allows for better light penetration. Recruitment also probably occurs quicker in the gulf due to its size and greater water movement as well as many planktonic juveniles. Employing the same method as the bay sites the fouling coverage of this site was determined to be 97%. This is an incredibly high number considering the fact that there were many sea urchins (Bay Ball vacuum cleaners) present.
Table
15.
Coverage of each of the Bay BallsÔ in Quadrants at 7-mile South Reef
|
|
|
Coverage (%) |
|
|
|
|
Bay Balls |
Quadrant Top/Left |
Quadrant T/R |
Quadrant Bottom/L |
Quadrant B/R |
|
|
1 |
100 |
100 |
90 |
90 |
|
|
2 |
100 |
100 |
100 |
100 |
|
|
3 |
100 |
100 |
90 |
100 |
|
|
4 |
100 |
90 |
100 |
90 |
|
|
5 |
100 |
100 |
90 |
100 |
|
Figure 12.
A picture of a Bay Ball in Sarasota Bay after less then a year underwater.
Appendix B
|
Dive#10 |
|
|
|
|
|
|
|
|
Reef Ball Sites |
Current |
Sedimen/posit |
Visibility |
Bottom
Time |
Depth |
Coverage |
Temp. |
|
Gerkin |
|
|
|
|
|
|
|
|
Hart |
|
|
|
|
|
|
|
|
Jantzen |
|
|
|
|
|
|
|
|
Saprito |
|
|
|
|
|
|
|
|
Walker |
|
|
|
|
|
|
|
|
|
|
|
|
|
|
|
|
|
Dive#11 |
|
|
|
|
|
|
|
|
Reef Ball Sites |
Current |
Sedimen/posit |
Visibility |
Bottom
Time |
Depth |
Coverage |
Temp. |
|
Gerkin |
|
|
|
|
|
|
|
|
Hart |
|
|
|
|
|
|
|
|
Jantzen |
|
|
|
|
|
|
|
|
Saprito |
|
|
|
|
|
|
|
|
Walker |
|
|
|
|
|
|
|
|
|
|
|
|
|
|
|
|
|
Dive#12 |
|
|
|
|
|
|
|
|
Reef Ball Sites |
Current |
Sedimen/posit |
Visibility |
Bottom
Time |
Depth |
Coverage |
Temp. |
|
Gerkin |
|
|
|
|
|
|
|
|
Hart |
|
|
|
|
|
|
|
|
Jantzen |
|
|
|
|
|
|
|
|
Saprito |
|
|
|
|
|
|
|
|
Walker |
|
|
|
|
|
|
|
|
|
|
|
|
|
|
|
|
|
Dive#13 |
|
|
|
|
|
|
|
|
Reef Ball Sites |
Current |
Sedimen/posit |
Visibility |
Bottom
Time |
Depth |
Coverage |
Temp. |
|
Gerkin |
|
|
|
|
|
|
|
|
Hart |
|
|
|
|
|
|
|
|
Jantzen |
|
|
|
|
|
|
|
|
Saprito |
|
|
|
|
|
|
|
|
Walker |
|
|
|
|
|
|
|
|
|
|
|
|
|
|
|
|
|
Dive#14 |
|
|
|
|
|
|
|
|
Reef Ball Sites |
Current |
Sedimen/posit |
Visibility |
Bottom
Time |
Depth |
Coverage |
Temp. |
|
Gerkin |
|
|
|
|
|
|
|
|
Hart |
|
|
|
|
|
|
|
|
Jantzen |
|
|
|
|
|
|
|
|
Saprito |
|
|
|
|
|
|
|
|
Walker |
|
|
|
|
|
|
|
References
Alderson, M. et al. “Sarasota Bay: Framework for action.” National Estuary Program. 1992.
Ardizzone, G. D., M. F. Gravina, and A. Belluscio. “Temporal development of Epibenthic communities on artificial reefs in the central Mediterranean Sea.” Bulletin of Marine Science. 44(2): 1989. 592-608.
Barinaga, Marcia. “Science Digest the Secrets of Voracious Killer Snails” Science. July 20,
1990. 250-251.
Birkland, Charles. Ed. Life and Death of Coral Reefs. New York, N.Y.; International
Thomson Publishing. 1997.
Bohnsack, James A., Douglas E. Harper, David B McClellan, and Mark Hulsbeck. “Effects of Reef Size on Colonization and Assemblage Structure of Fishes at Artificial Reefs off Southeastern Florida, USA”. Bulletin of Marine Science. 55(2-3). 1994. 796-823.
Bortone, Stephen A., Tony Martin, and Charles M. Bundrick. “Factors affecting Fish Assemblages Development on a Modular Artificial Reef in a Northern Gulf of Mexico Estuary.” Bulletin of Marine Science. 55(2-3): 1994. 319-332.
Chou, L.M. Artificial reefs of Southeast Asia- Do they enhance or degrade the marine environment. Netherlands: Kluwer Academic Publishers. 1997.
Coll, J., J. Moranta, O. Renones, A. Garcia-Rubies, and I. Moreno. “Influence of substrate and deployment time on fish assemblages on an artificial reef at Formentera Island.” Hydrobiologia. 385: 1998. 139-152.
Culter, James K., and Cliff Truitt, D.Eng. Artificial Reef Construction as a Soft Bottom Habitat Restoration Tool. Mote Marine Laboratory Technicial Report Number 530. 30 June, 1997.
Darwin, Charles. The Structure and Distribution of Coral Reefs. Los Angeles, CA: University
of California press. 1962.
Deitsch, Jeremy Stafford. Reef. San Francisco, CA: Sierra Club Books. 1991.
Dubinsky, Z. Ed. Coral Reefs. Amsterdam, NY: Elsevier, 1990
Garrison, Tom. Oceanography. Pacific Grove, CA: Brook/Cole*Wadsworth. 1998.
Jaap, Walter C. “Coral Reef Restoration.” Ecological Engineering. 15, 2000. 345-364.
Levinton, Jefferies S. Marine Ecology. Englewood Cliffs, CA: Prentice-Hall Inc. 1982.
Nakamura, Makoto. “Evolution of Artificial Reef concepts in
Japan.” Bulletin of Marine
Science. 37(1): 1985. 271-278.
Nybakken, James W. Marine Biology: An Ecological Approach. New York, NY: Harper &
Row. 1982.
Odum, Howard T. Eugene P. Odum. “Trophic Structure and Productivity of a Windward Coral
Reef Community on Eniwetok Atoll.” Ecological Monographs. Vol. 25, July, 1955.
Pickering, Helen., and David Whitmarsh. “Artificial reefs and fisheries expoitation: a review of
the attraction versus production’ debate, the influence of design and it’s signifiance for policy.” Fisheries Reasearch. 31, 1997. 39-59.
Pickering, H., D. Whitmarsh, and A. Jensen. “Artificial Reefs as a tool to aid Rehabilitation of Coastal Ecosystems: Investigating the potential.” Marine Pollution Bulletin. Vol. 37
1998. 505-514.
Pratt, James R. “Artificial habitat and Ecosystem
restoration managing for the future.” Bulletin
of Marine Science. 55(2-3): 1994. 268-275
Sanders, R.M. Jr., C.R. Chandler, and A.M. Landry Jr. “Hydrological, diet and lunar factors
affecting fishes
on Artificial Reefs off Panama City, Florida.”
Bulletin of Marine
Science. 37: 1985. 318-327.
Seaman, William Jr. Ph. D. Artificial Reef Evaluation. Boca Raton, FL: CRC Press. 2000.
Weisburd, Stefi. “Artificial Reefs” Science News. 26 July, 1986. 59-61.
Wood, Rachel. Reef Evolution. Oxford, England: Oxford University Press, 1999.