|
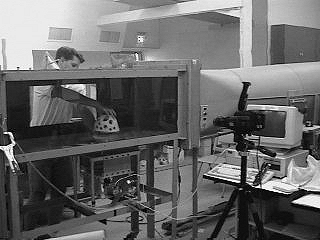
This report documents the stability analyses performed for the above three type of artificial reef units. Wind tunnel tests were performed to determine drag coefficients of the units. Wave tank tests were performed to evaluate the stability of the units during wave attack, using a scale model Reef Ball unit deployed at various depths, and under varying wave conditions. Analytical analyses were performed based on the results of the wave tank tests, and the results are presented in numerous graphs in the Appendix. These graphs can be utilized to determine the required sizes and weights of Reef Ball units needed for stability for different design depth and wave conditions. {NOTE: THE REEF BALL DEVELOPMENT GROUP, LTD WILL INTERPRET THESE GRAPHS AS A SERVICE TO OUR CLIENTS} 2.0 METHODOLOGY 2.1 THEORY Linear wave theory was used though out the stability analysis. This was done for the ease of use for the calculations. The basic equation for the stability of submerged objects is a balance between the lateral wave forces and the resisting forces. Fwave = Fdrag + Finertia = Resistance Force = *(Weight - Buoyancy - Flift) EQN 1. Fdrag and Finertia are lateral wave forces, and * is the coefficient of static friction of an object resting on sand (* = 0.6 used in this analysis). Weight is the dry weight of the module and Flift is the wave induced lift force. The lift force is assumed to be one-half of the drag force. This is a conservative estimate and contributes to the safety factor in the analysis. A set of wave periods were selected for the analysis (8, 10, 11, 12, 14, 16, 20, 24 seconds). Next, using the U.S. Army Corps of Engineer's Automated Coastal Engineering System (ACES) computer software analysis program, wave lengths were calculated for waves with the above periods at depths from 10 feet to 120 feet. Finally, a range of wave heights were selected to represent normal and storm conditions (3', 5', 7', 10', 15', 20', 25'). Since the analysis includes shallow water depths, it is necessary to determine if any of the design waves have broken. For example, a 25 foot high wave can not exist in 10 feet of water. Two checks are performed to test for breaking waves. If the wave has broken, the largest wave which can exist at a given depth is used in the calculations, otherwise the given design wave height is used. Based on the wave period, wave height, and wave length at a given depth, the horizontal water particle velocity can be calculated using the following equation: EQN 2. Where U is the maximum horizontal particle velocity, H is the wave height, T is the wave period, k is the wave number (k = 2*/L), d is the water depth, and z is the depth at which the particle velocity was calculated. For all the calculations, the depth analyzed was 6 feet above the sea floor, so that (z + d) = 6 feet. The drag force is calculated using the classic drag equation: EQN 3. Where CD is the coefficient of drag, * is the density of sea water, and Area is the projected cross sectional area of the module. See Section 2.2, Wind Tunnel Model Tests, for further details on the determination of values for CD. By adding in a safety factor (SF = 2) into Equation 1 and solving for the weight, the final equation for the required module weight is obtained: EQN 4. Equation 4 does not include the inertia force which is shown in Equation 1. This is done because as a wave passes, the maximum drag and inertia forces occur at different points in the wave cycle, thus the effects are not cumulative. Also, the inertia force is negligable when compared to the drag force, allowing the ineriia force to be dropped from the calculations. 2.2 WIND TUNNEL MODEL TESTSIn the early stages of the analysis, it was determined that the coefficient of drag (CD) would be very crucial in the calculations. In order to get a better idea as to what this number would be, a series of wind tunnel tests was conducted at the Florida Tech wind tunnel using one of the reef ball scale models. The model used was approximately five inches high, with a six-inch diameter base. The following photograph shows the test section of the Florida Tech wind tunnel.
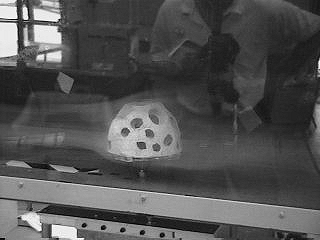
Instrumentation consists of strain gages connected to the vertical rod supporting the Reef Ball unit, which are connected to the computer for analysis and recording. The video camera mounted on the tripod is used to document the flow around the unit, as smoke is injected into the tunnel, as shown in Figure 2 below (which does have considerable reflection from the front glass).
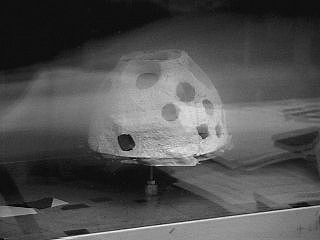
{Omitted to save download time.) PHOTOGRAPH 3. REEF BALL UNIT IN WIND TUNNEL (Light refection off the front glass of the test section creates distortion in the picture.) The wind tunnel tests were used to determine the drag coefficient (CD) for the Reef Ball(TM) scale model units. To confirm the accuracy of the wind tunnel data, a smooth, metal cylinder was also tested. The results of the tests for the Reef Ball (TM) and the cylinder are presented and discussed in Section 3 of this report. For visualization of the fluid flow around the Reef Ball(TM) unit, smoke was injected into the wind flow, as shown previously in Photograph 2 and in Photograph 4 below.
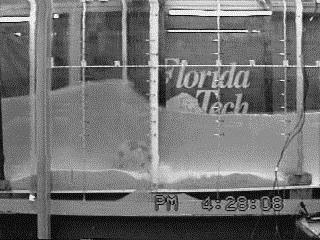
2.3 WAVE TANK MODEL TESTSWave tank model tests were performed using the Reef Ball(TM) scale model. The Florida Tech wave tank is a free standing, steel beam frame structure with glass sides and open top. The internal dimensions of the wave tank are thirty feet long by twenty-two and one-half inches wide by three feet deep (30' x 221/2" x 3'). An eight-foot (8') long, smooth plastic section comprises the bottom where the test units are located. A second eight foot (8'), smooth plastic section is used as a variable slope beach and wave absorber on the lee side of the units. The wave absorbing angle is changed for each water depth or wave height. Wave energy is thus more efficiently absorbed, and reflection off the back vertical glass wall of the tank is reduced. Changing the angle of the wave absorber also reduces reflection off the absorbing plastic sheet itself. Water depths for testing are adjusted by filling or draining the tank. A pivoting, flap type, paddle wavemaker generates waves through a rotary motor. Wave period is regulated by the speed of the motor, while stroke length is regulated by the position of the connecting rod on the radius of the plate attached to the motor. The size and characteristics of the Florida Tech wave tank caused some limitations in wave generation. The motor power and allowable radius of the plate limited the maximum wave height to approximately nine inches (9"), depending on water depth, and a period of approximately 1.5 to 4.0 seconds. Larger waves at shallower water depths were unattainable due to the characteristics of the paddle type wavemaker. Larger waves and shorter periods were therefore obtained by manually operating the paddle. While this method produced less consistent waves, it allowed for larger wave heights and longer periods. However, waves large enough to cause unit movement and structural instability could not be generated for some of the water depths in the wave tank tests. A second limitation attributable to the size of the wave tank is wave reflection. Reflection from the paddle occurs due to its proximity to the structure and the first two wave gages. The adjustable angle of the absorbing beach is limited, so as waves become larger, water that overtops the beach can result in some reflection from the back vertical wall of the tank. As water depth increases, the absorbing beach requires a steeper angle which may increase reflection off the beach itself. Therefore the wavetank test results should be used primarily for comparison purposes between the different types of units tested. Due to the height of the foreshore slope and the wave heights generated, the maximum allowable depth for testing is approximately twenty-two inches (22"). For stability tests, one wave gage was located directly adjacent to the individual Reef Ball (tm) model test unit to record wave height. The gage was connected to an IOmega Tech Daq Book data acquisition system and Gateway laptop computer. SnapMaster software from HEM was used to run the instrumentation. Wave records of voltage were transformed into wave height records by calibration of the gages at each water level. The tests were videotaped using a tripod mounted camcorder, making it possible to correlate visual and wave height records. Video shot during testing was used to help determine points of unit instability as well as wave interaction characteristics. Some photographs from video frames shot during the tests are shown in the photographs on the following pages.
PHOTOGRAPH 5. WAVE TANK TESTS OF REEF BALL MODEL
(a) 12" water depth on smooth bottom (c) 15" water depth on smooth bottom (e) 18" water depth on smooth bottom (b) 12" water depth on sand bottom (d) 15" water depth on sand bottom (f) 18" water depth on sand bottom
3.0 RESULTS 3.1 WIND TUNNEL TEST RESULTS The results of the wind tunnel tests are shown below in Figure 3. The results show that values for CD range from 0.8 to 1.0 for most Reynolds Number values. The Reynolds Number is defined as an index of flow rate and turbulence, the higher the value the greater the flow rate and turbulence. The Reynolds Number also allows the test results to be used for any fluid, both gases and liquids, and provides the mechanism for converting the values according to the density and viscosity of the fluids. FIGURE 3. WIND TUNNEL TEST RESULTS From these results, two different values for the drag coefficient (CD) were used for the stability analysis. In shallow water (10 to 30 feet) where the water velocities are large, CD was set to 1.2. For deeper water, the CD was set to 1.0. The increase in drag coefficient for Reynolds Number greater than 200,000 warrants further investigation, and could be further examined by using a larger scale model in the wind tunnel. 3.2 WAVE TANK TEST RESULTS Wave stability tests were conducted by generating increasingly larger wave heights until movement of an individual unit was observed. Various water depths were tested. The video camera record indicated the exact moments of initiation of unit movement. The point of unit movement was then correlated with the appropriate wave height through the wave record. Individual units were tested on both (1) a smooth bottom and (2) a sand bottom, to evaluate the stability of the units on both hard and soft bottoms. The test results for the largest waves for which the model unit remained stable are shown in Table 2 below. For the 18-inch water depth, the Reef Ball model unit remained stable for the largest wave height able to be generated in the wave tank, 9.19 inches. Therefore, a wave height greater than 9.19 inches would be necessary for movement of the Reef Ball. The test results in Tables 2 & 3 can be applied to full-scale reef units by appropriate scale factors, as further discussed in the following section of this report. TABLE 2. WAVE TANK STABILITY TEST RESULTS (HARD BOTTOM) UNIT TYPE STRUCTURE HEIGHT WATER DEPTH WAVE HEIGHT PERIOD
TABLE 3. WAVE TANK STABILITY TEST RESULTS (SAND BOTTOM) UNIT TYPE STRUCTURE HEIGHT WATER DEPTH WAVE HEIGHT PERIOD
3.3 WAVE TANK STABILITY ANALYSIS CORRELATION The stability analysis was corroborated using the results of the wave tank testing. Using the procedure presented in the Methodology Section for the stability analysis, the predicted required weight should be greater than the actual weight of the model used in the wave tank tests. The actual weight of the Reef Ball model was 4.34 pounds. Table 3 is a summary of the three wave conditions from the wave tank tests used to verify the results of the stability analysis and the predicted required weight.
TABLE 4. PREDICTED REQUIRED WEIGHT FOR UNIT STABILITY (HARD BOTTOM)
Predicted Required Weight Wave Height Wave Period Water Depth Linear Cnoidal 0.50 feet 2.6 sec 1.00 feet 3.23 lbs 8.60 lbs 0.55 feet 1.7 sec 1.25 feet 2.62 lbs 6.13 lbs 0.61 feet 1.8 sec 1.50 feet 2.49 lbs 6.13 lbs TABLE 5. PREDICTED REQUIRED WEIGHT FOR UNIT STABILITY (SAND BOTTOM)
Predicted Required Weight Wave Height Wave Period Water Depth Linear Cnoidal 0.52 feet 1.7 sec 1.00 foot 3.31 lbs 7.66 lbs 0.59 feet 1.9 sec 1.25 feet 3.14 lbs 7.59 lbs 0.77 feet 1.8 sec 1.50 feet 3.92 lbs 10.64 lbs
Using the information in Tables 4 & 5 it is possible to scale the results, using Froude model law scaling to transform the wave tank waves into real waves. Tables 6 & 7 shows the results of this Froude scaling, for linear wave theory only, as applied to all three reef ball types.
TABLE 6. RESULTS OF FROUDE SCALING (HARD BOTTOM) Wave Height Wave Period Water Depth Required Weight Bay Ball (Scale Factor = 4.8) 2.40 feet 5.7 sec 4.8 feet 357 lbs 2.64 feet 3.7 sec 6.0 feet 290 lbs 2.93 feet 3.9 sec 7.2 feet 275 lbs Pallet Ball (Scale Factor = 7.2) 3.60 feet 7.0 sec 7.2 feet 1206 lbs 3.96 feet 4.6 sec 9.0 feet 978 lbs 4.39 feet 4.8 sec 10.2 feet 929 lbs Reef Ball (Scale Factor = 9.6) 4.8 feet 8.1 sec 9.6 feet 2858 lbs 5.28 feet 5.3 sec 12.0 feet 2318 lbs 5.86 feet 5.6 sec 14.4 feet 2203 lbs TABLE 7. RESULTS OF FROUDE SCALING (SAND BOTTOM) Wave Height Wave Period Water Depth Required Weight Bay Ball (Scale Factor = 4.8) 2.50 feet 3.7 sec 4.8 feet 366 lbs 2.83 feet 4.2 sec 6.0 feet 347 lbs 3.70 feet 3.9 sec 7.2 feet 434 lbs Pallet Ball (Scale Factor = 7.2) 3.74 feet 4.6 sec 7.2 feet 1235 lbs 4.25 feet 5.1 sec 9.0 feet 1172 lbs 5.54 feet 4.8 sec 10.2 feet 1463 lbs Reef Ball (Scale Factor = 9.6) 4.99 feet 5.3 sec 9.6 feet 2928 lbs 5.66 feet 5.9 sec 12.0 feet 2778 lbs 7.39 feet 5.6 sec 14.4 feet 3468 lbs
From all of the analyses performed for this study, stability curves for all three Reef Ball artificial reef unit types were prepared, and are included in the Appendix. The results are broken down by module type and wave period. Each graph contains stability curves for seven different wave heights, and presents the minimum required unit weight for stability, as shown in one of the graphs reproduced below: FIGURE 4. MINIMUM REQUIRED WEIGHT FOR REEF BALL UNIT STABILITY for various water depths and wave heights with wave period of 10 seconds. 4.0 CONCLUSIONS AND RECOMMENDATIONS Design data for Reef Ball, Pallet Ball and Bay Ball artificial reef units resulted from the combination of wind tunnel, wave tank, and analytical analyses. The results of this study present the minimum required individual unit weights required for structural stability. The only structural instability noted in the wave tank tests was sliding, which occurred for much higher wave heights for units on a sand bottom as compared with those on a smooth bottom. No overtopping of the units was ever observed. Due to the increase in drag coefficient at the highest values of Reynolds Number tested in the wind tunnel, it is recommended that the wind tunnel analysis be continued to further examine the characteristics of the reef ball at higher Reynolds Numbers. This would require further wind tunnel tests using a larger scale model. If it is determined that the coefficient of drag increases substantially, the stability analysis should be modified to reflect these increases. 5.0 TECHNICAL REFERENCES Dean, Robert and Dalrymple, Robert, 1991. Water Wave Mechanics for Engineers and Scientists. World Scientific, New Jersey.. Roberson, John and Crowe, Clayton, 1990. Engineering Fluid Mechanics. Houghton Mifflin Company, Boston, MA. U.S. Army Corps of Engineers, 1994. Automated Coastal Engineering System (ACES). Coastal Engineering Research Center, Waterways Experiment Station, Vicksburg, Mississippi. Version 1.07e. U.S. Army Corps of Engineers, 1984. Shore Protection Manual. Coastal Engineering Research Center, Waterways Experiment Station, Washington, D.C.: U.S. Government Printing Office. 2 Vols.
Some tables and appendixes are not shown to prevent abuse. RBDG, Ltd. will interpret this data for all clients to insure that Reef Balls remain stable. If you have questions regarding stability, give us a call (941-752-0169) or e-mail us .
|